Post by syzygy on Dec 14, 2018 8:39:12 GMT
sorry I just could not do animated gif overlay kmz (is it possible?) for this one, however very easy to find location just below the K2 peak.
more from source: earthobservatory.nasa.gov/images/144376/ice-loss-slows-down-asian-glaciers
Ice Loss Slows Down Asian Glaciers

2000 - 2016
A NASA-led, international study finds Asia’s high-mountain glaciers are flowing more slowly in response to widespread ice losses. Analyzing two million pairs of satellite images, researchers measured the slowdown of glaciers in the region and found that 94 percent of the differences in flow rates could be explained by changes in ice thickness.
...
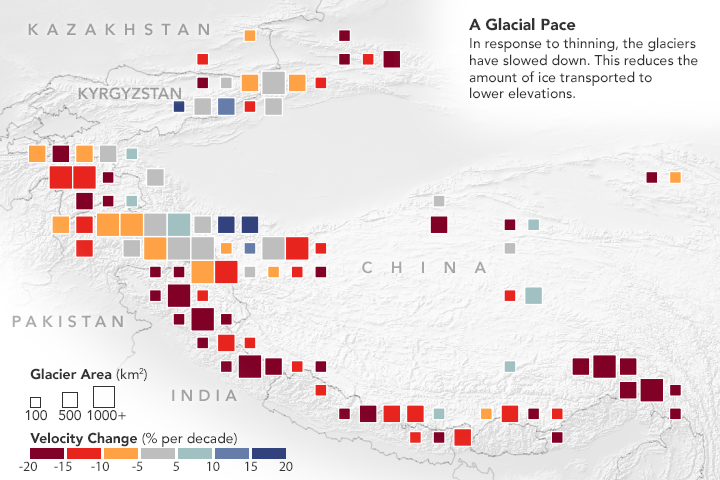
The map above depicts changes in glacier flow velocity in Asia from 2000 to 2017. Scientists have sought to understand what is regulating the flow speeds of glaciers in order to project how meltwater will contribute to the region’s water resources and to sea level rise. Observing the glaciers from the ground is difficult because of their huge geographic expanse and inaccessibility, so the researchers turned to satellite images.
...
A NASA-led, international study finds Asia’s high-mountain glaciers are flowing more slowly in response to widespread ice losses. Analyzing two million pairs of satellite images, researchers measured the slowdown of glaciers in the region and found that 94 percent of the differences in flow rates could be explained by changes in ice thickness.
...

1991 - 2002
...
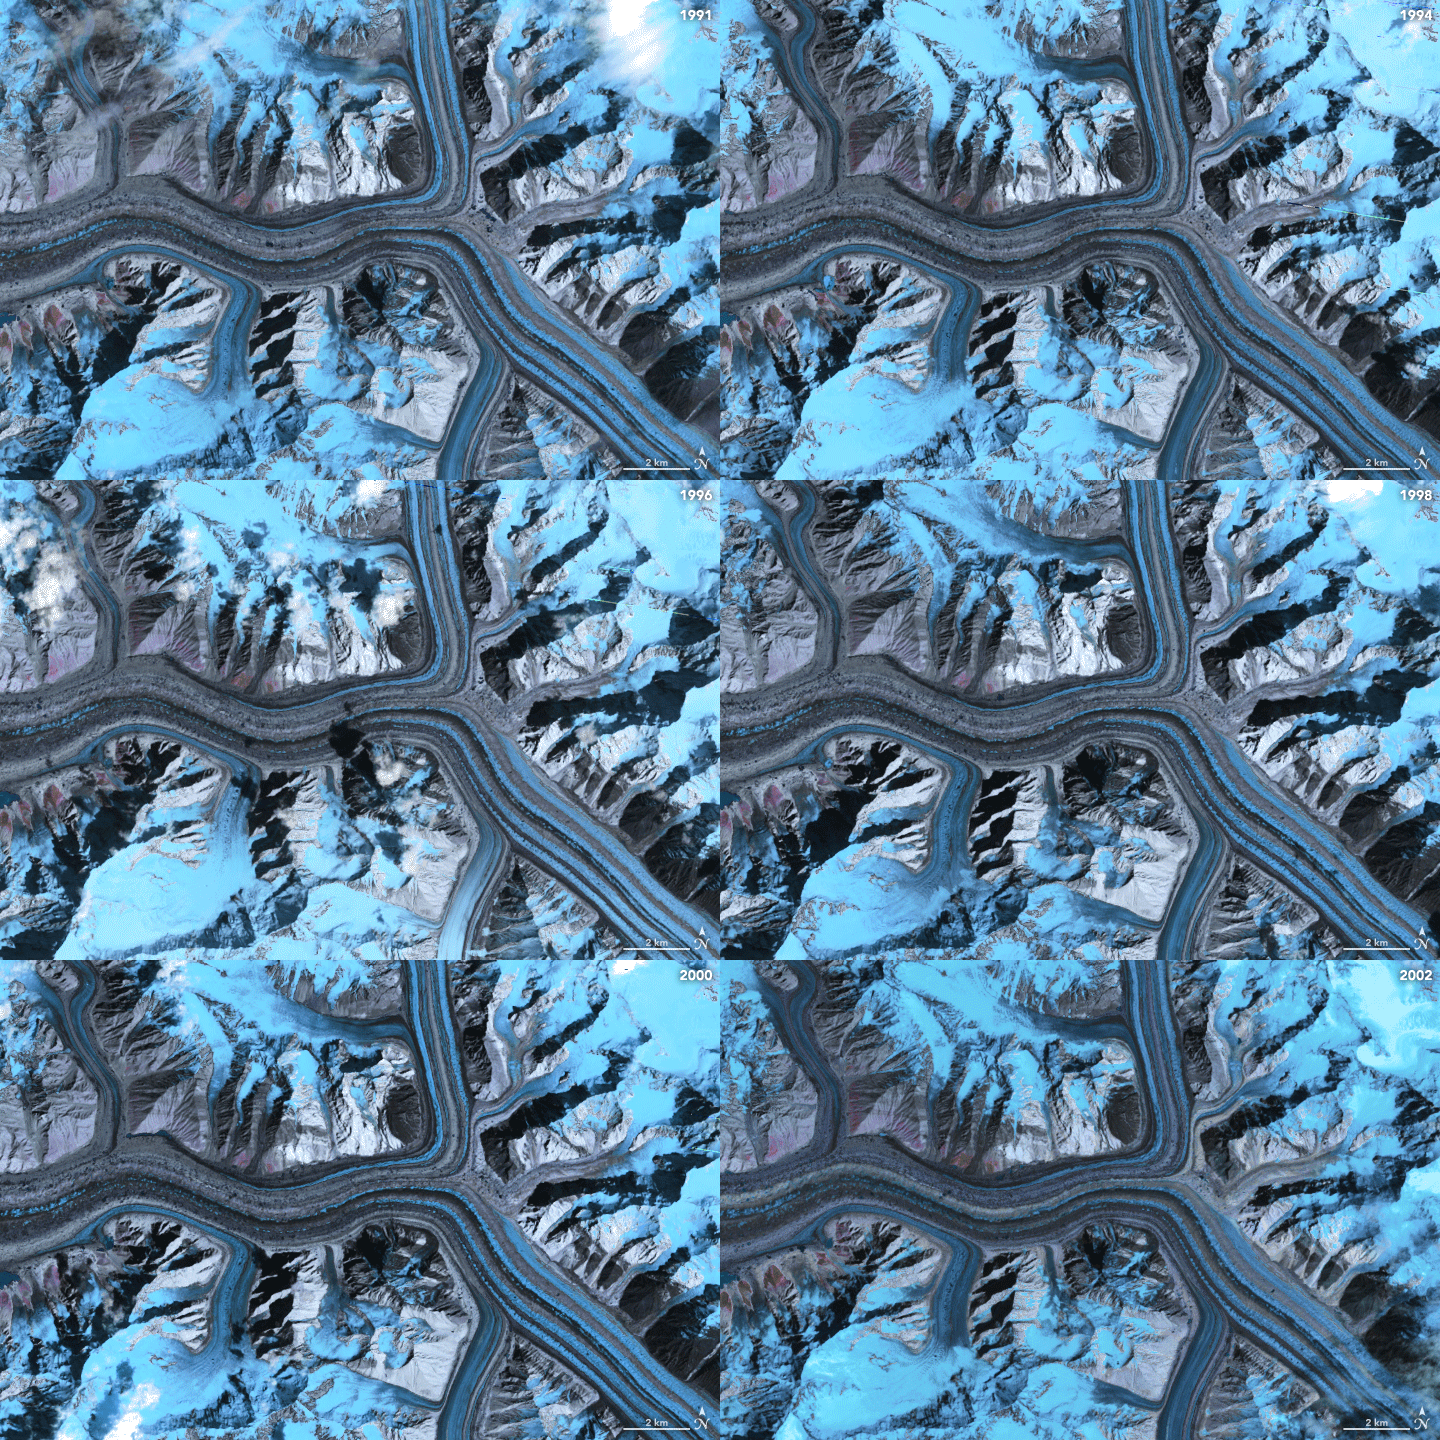
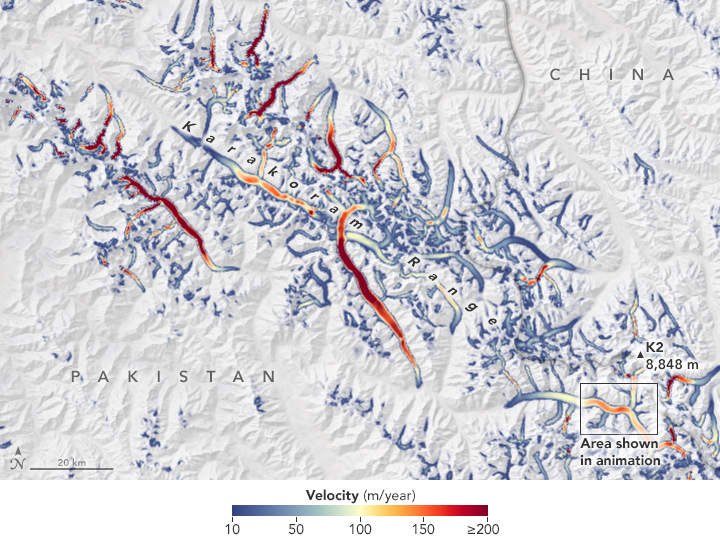
The animation above shows a sequence of false-color images from Landsat 5 and 7 (wavelength bands 5-4-3) of Baltoro Glacier flowing in the Karakoram range from 1991 to 2002. The moving ice appears in shades of gray and blue; the brighter blues on the surrounding landscape are changing snow and ice cover. The image below is an example of the flow velocity maps that Dehecq, Gardner, and colleagues can derive from such imagery.

2000 - 2017
...

2000 - 2016
A NASA-led, international study finds Asia’s high-mountain glaciers are flowing more slowly in response to widespread ice losses. Analyzing two million pairs of satellite images, researchers measured the slowdown of glaciers in the region and found that 94 percent of the differences in flow rates could be explained by changes in ice thickness.
...
The map above depicts changes in glacier flow velocity in Asia from 2000 to 2017. Scientists have sought to understand what is regulating the flow speeds of glaciers in order to project how meltwater will contribute to the region’s water resources and to sea level rise. Observing the glaciers from the ground is difficult because of their huge geographic expanse and inaccessibility, so the researchers turned to satellite images.
...
A NASA-led, international study finds Asia’s high-mountain glaciers are flowing more slowly in response to widespread ice losses. Analyzing two million pairs of satellite images, researchers measured the slowdown of glaciers in the region and found that 94 percent of the differences in flow rates could be explained by changes in ice thickness.
...

1991 - 2002
...
The animation above shows a sequence of false-color images from Landsat 5 and 7 (wavelength bands 5-4-3) of Baltoro Glacier flowing in the Karakoram range from 1991 to 2002. The moving ice appears in shades of gray and blue; the brighter blues on the surrounding landscape are changing snow and ice cover. The image below is an example of the flow velocity maps that Dehecq, Gardner, and colleagues can derive from such imagery.

2000 - 2017
...
