Impact CHURCHILL-NELSON Water Diversion- Manitoba
Jan 3, 2017 1:58:17 GMT
Admin and syzygy like this
Post by jeanthie on Jan 3, 2017 1:58:17 GMT
MONITORING ECOSYSTEMS WITH SATELLITES: THE CHURCHILL-NELSON RIVERS DIVERSION IN MANITOBA
In September of 1969 I was doing fieldwork in Northern Manitoba as part of the Canada Land Inventory Project and the in preparation of the Manitoba Remote Sensing Test Projects. Our fieldwork was concentrated that year in the Wekusko (63J), Grand Rapids(63G), Norway House (63H) and Cross Lake (63I) topographic map sheet areas. During the fieldwork using helicopters, fixed wing aircraft, and boats we collected a wide range of vegetation, soil, and photographic data.
Since I seem to have some time at hand, I am reviewing now, almost 50 years later to see if our predictions then, are now visible on satellite images. As can be seen from some of my other posts, my special interest is the study of the melting of permafrost in palsas and peat plateaus so common in these area. My original slides taken during the fieldwork show some interesting aspects of flooding. For example the slide/photos in this post show the impact of the start of the flooding caused by the Churchill-Nelson River Diversion Project in Northern Manitoba:
1969 Photo of Flooding impact

Google Earth does not provide a great resolution image for this area, but Apple Maps program provides very high resolution images for part of this area. In spite of the clouds the image shows that the floating wetlands are still floating. Dead trees have been removed along the shoreline. The logging road is visible on both the Google Earth and Apple Maps image. It did not exist at the time of the helicopter photo.
2012/13? Image taken from Apple Maps

The amount of tree kill is very high because wetlands with permafrost were flooded. The original floating peat wetlands adjusted to the new water level (green arrow right)l, but the mainly Black Spruce forest on peat plateaus were flooded and killed (red arrow). It is interesting to see that the former collapse scars of the peat plateaus also float and adjusted to the new water level (green arrow left). Both satellite images show the very murky colour of the lake water. Much of the original shoreline was composed of lacustrine clay and silt deposits from Glacial Lake Agassiz. Since the flooding the erosion of this silt and clay have changed the lake.
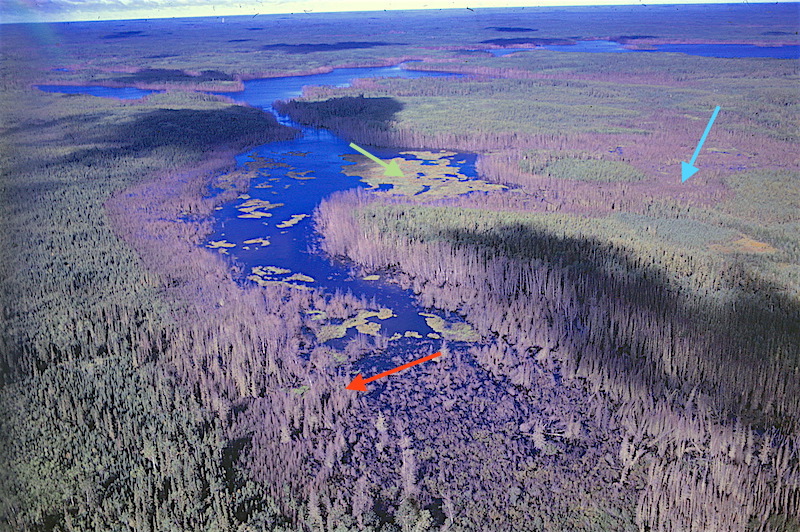
Also the slide below provides a good visualization of the extent of the flooding damage. The the tree kill along the shorelines is quite obvious. Also the tree kill in wetland is extensive(light blue arrow)
1969 Photo of Flooding Impact

Attached is also the KMZ file with the locations on Google Earth. More information on www.geostrategis.com/p_churchill-nelson.htm
Churchill-Nelson-Rivers-diversion.kmz (1006 B)
In September of 1969 I was doing fieldwork in Northern Manitoba as part of the Canada Land Inventory Project and the in preparation of the Manitoba Remote Sensing Test Projects. Our fieldwork was concentrated that year in the Wekusko (63J), Grand Rapids(63G), Norway House (63H) and Cross Lake (63I) topographic map sheet areas. During the fieldwork using helicopters, fixed wing aircraft, and boats we collected a wide range of vegetation, soil, and photographic data.
Since I seem to have some time at hand, I am reviewing now, almost 50 years later to see if our predictions then, are now visible on satellite images. As can be seen from some of my other posts, my special interest is the study of the melting of permafrost in palsas and peat plateaus so common in these area. My original slides taken during the fieldwork show some interesting aspects of flooding. For example the slide/photos in this post show the impact of the start of the flooding caused by the Churchill-Nelson River Diversion Project in Northern Manitoba:
1969 Photo of Flooding impact

Google Earth does not provide a great resolution image for this area, but Apple Maps program provides very high resolution images for part of this area. In spite of the clouds the image shows that the floating wetlands are still floating. Dead trees have been removed along the shoreline. The logging road is visible on both the Google Earth and Apple Maps image. It did not exist at the time of the helicopter photo.
2012/13? Image taken from Apple Maps

The amount of tree kill is very high because wetlands with permafrost were flooded. The original floating peat wetlands adjusted to the new water level (green arrow right)l, but the mainly Black Spruce forest on peat plateaus were flooded and killed (red arrow). It is interesting to see that the former collapse scars of the peat plateaus also float and adjusted to the new water level (green arrow left). Both satellite images show the very murky colour of the lake water. Much of the original shoreline was composed of lacustrine clay and silt deposits from Glacial Lake Agassiz. Since the flooding the erosion of this silt and clay have changed the lake.
Also the slide below provides a good visualization of the extent of the flooding damage. The the tree kill along the shorelines is quite obvious. Also the tree kill in wetland is extensive(light blue arrow)
1969 Photo of Flooding Impact

Attached is also the KMZ file with the locations on Google Earth. More information on www.geostrategis.com/p_churchill-nelson.htm
Churchill-Nelson-Rivers-diversion.kmz (1006 B)


