Full Member
Cartographer
May 2015 - Oct 21, 2024 18:35:52 GMT
“ Fellow Royal Canadian Geographical Society „
|
Post by jeanthie on Jul 13, 2015 2:21:09 GMT
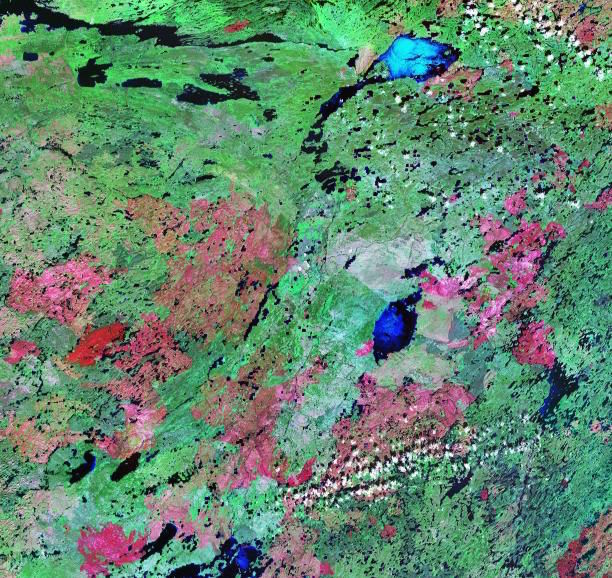
Jus a few days ago I looked through an 'old' NASA publication 1976 - Mission to Earth: Landsat Views The World. I saw some of the plates and descriptions I had contributed to this publication while I was working as Head of Applications of the Canada Center for Remote Sensing in the 70's.  With a number of these I would like to start a new thread on Fires and Ecosystems. Not directly focussed on active fires around the world. On the old Google Earth forum there were some amazing examples of fire actual mapping. My interest and focus is more on the ecological significance of fires, the impact of repeated fires on ecosystems, vegetation, soils, fauna and permafrost. Understanding of fire history is a fundamental ingredient to interpret satellite imagery whether you use visual or automated computer methods. In 1974 I was very excited to see the Landsat image below. It was taken on January 31st 1974. It is plate 166 in the Mission to Earth publication. It showed for the first time the complexity and importance of fires in the Boreal Ecosystem. We knew this, but never had been able to communicate and visualize this as satellite did. The snow cover on the ground enhances the image in a way which provides a unique perspective on the complexity of repeated fires. Tree density, aging of burns and regeneration allow mapping of fire history. Most of the was burned at least 2-3 times in the last 100 years. link The dynamics of change is also clearly visible in this NASA 2000 Pseudo color image. The most recent fires (last decade) are red and pink. On the winter image above, the very recent fires are various shades of grey. There the snow is more visible because of the lack of needles on the dominant evergreen trees like spruce and pine.  The NASA 1990 pseudo color images below shows deep reddish pink areas, recent burns, which 10 years later have become a misture of light green-pink on NASA 2000  mission to earth.kmz mission to earth.kmz (155.23 KB) |
|
March 2015 - May 1, 2023 4:20:37 GMT
|
Post by diane9247 on Jul 17, 2015 23:06:56 GMT
Jeanthie, I remember the fire posts in the old GEC and I believe some of them were done by Marcopolo, a firefighter, but I believe some were about fires in progress and also done by firefighters. I did find THESE few posts searching "fires ecosystems." Perhaps Hill can find more, he's much better at finding things than I am! The pseudo color images are much easier for the layperson to comprehend (that would be moi!). |
|
Full Member
Cartographer
May 2015 - Oct 21, 2024 18:35:52 GMT
“ Fellow Royal Canadian Geographical Society „
|
Post by jeanthie on Jul 22, 2015 0:58:49 GMT
Diana, Thanks for the links to posts in the old Forum. I had in mind the Modis type of global fire mapping, as in the animated gif below which were displayed on the Google Earth base. The early successes in Landsat Applications (in Canada) were in fire mapping and ice reconnaissance. Two extremes, but easy to monitor with low resolution satellites. The red dots below reflect the number of fires; their size and coalescence exaggerate the area burned in the low and middle latitudes.  Todays active fires are mapped with the Canadian Wildland Fire Information System see below Todays active fires are mapped with the Canadian Wildland Fire Information System see above |
|
March 2015 - May 1, 2023 4:20:37 GMT
|
Post by diane9247 on Jul 23, 2015 5:32:23 GMT
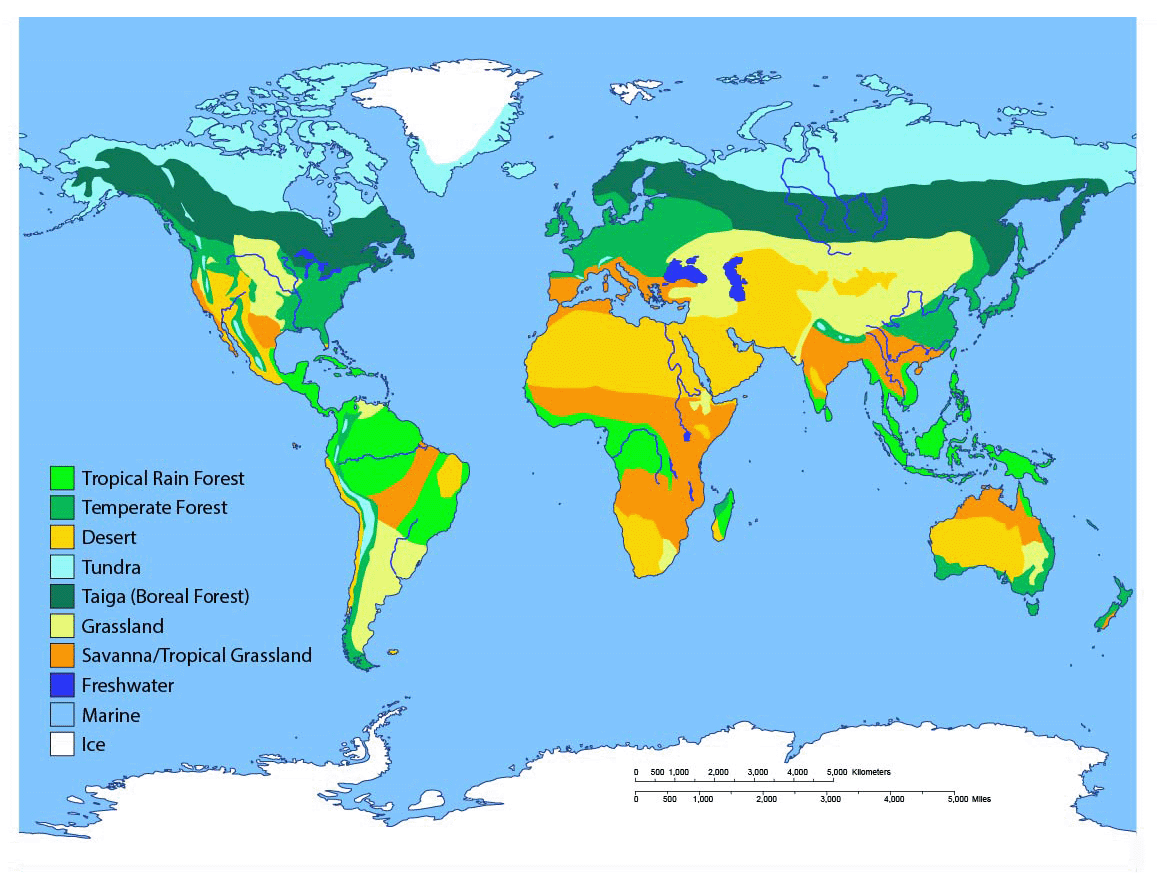
Those are great maps. The solid red of the Congo and Brazil during much of the year isn't surprising, considering the almost constant lightning there, but, I imagine agricultural burning accounts for quite a bit of it. I am shocked by how much of Canada and Alaska are on fire. This must be fairly catastrophic for large areas of tundra. I had to find a map to clarify for myself exactly where the tundra zone is. So, for other non-scientists...  Biome map from Arizona State Univ.
|
|
Full Member
Cartographer
May 2015 - Oct 21, 2024 18:35:52 GMT
“ Fellow Royal Canadian Geographical Society „
|
Post by jeanthie on Jul 26, 2015 1:35:53 GMT
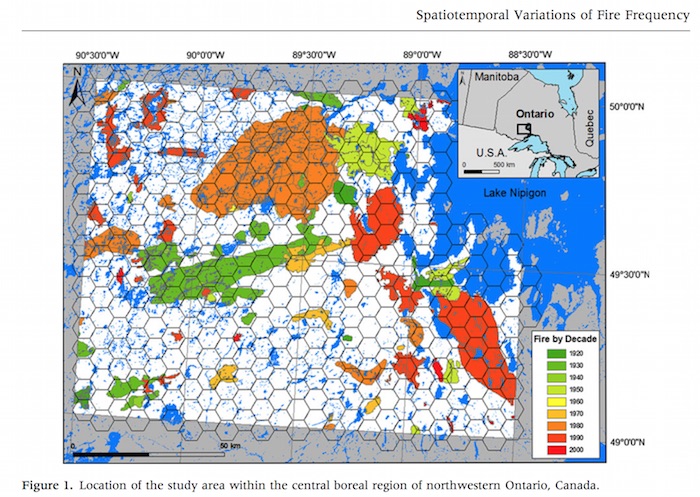
Diana, Wild land fires are part of the natural ecosystem in the boreal and tundra regions. Therefore 'catastrophic' is not appropriate term from and ecosystem point of view. They could of course threaten northern communities but most are burning in remote areas and were started by lightning. These northern fires tend to be large fires which start and are extinguished by 'Nature'. Fires are typically fought when communities and / or commercial forests are threatened. Canada's National Parks are a good example of the evolution of thinking about fires as part of ecosystems. I would like to think that satellite imagery and monitoring systems have contributed to this evolution in thinking and ecosystem management policy. Many if not most of the boreal and sub arctic ecosystems are fire dependent ecosystems and that is what the first image of this thread showed. I have included another image taken of approximately the same area about two months later: Only the darkest forest stands are over 100 years old, less than 5% of the image. Most areas were burned 2 and perhaps 3 times per 100 years.  Fire Frequency Fire Frequency is an important part of the discussion about the impact of climate warming. Under most scenarios frequency in the boreal is about to increase , but the rates of increase may be quite different between the Western, Central and Eastern Boreal zone. I will add some more information on the changes in fire frequency during the last 8000 years in response to the changes in climate. For example in Eastern Canadian part of the Boreal Zone fire frequency has been studied by Ahmed El-Guellab1, Hugo Asselin*, Sylvie Gauthier, Yves Bergeron and Adam A. Ali and reported in Holocene variations of wildfire occurrence as a guide for sustainable management of the northeastern Canadian boreal forest Link. The figure below shows a present fire frequency of less than 4 per 1000 years. Much lower than is seen on the Landsat satellite image above. As the authors summarize: Fire occurrence varied between the four studied sites, but fires generally occurred more often during warm and dry periods of the Holocene, especially during the Holocene Thermal Maximum (7000–3500 cal. BP), when fire occurrence was twice as high as at present....The current fire regime in the study area is still within the natural range of variability observed over the Holocene. However, climatic conditions comparable to the Holocene Thermal Maximum could be reached within the next few decades, thus substantially reducing the amount of wood available to the forest industry.  For Central Boreal Canada, the following images provides a visual perspective for the fire frequency between 1920 and 2000: (source Spatiotemporal Variations of Fire Frequency in Central Boreal Forest by Dominic Senici, Han Y. H. Chen, Yves Bergeron,and Dominic Cyr) |
|
Full Member
Cartographer
May 2015 - Oct 21, 2024 18:35:52 GMT
“ Fellow Royal Canadian Geographical Society „
|
Post by jeanthie on Jul 30, 2015 2:57:23 GMT
One of the studies I found very interesting was by carried out by Jacques Tardiff at the Centre for Forest interdisciplinary Research (C-FIR), University of Winnipeg. It provides a unique 300 year perspective of fire history in the Duck Mountain Provincial Forest (DMPF), Manitoba. The duck Mountains can be seen as representative of the central part of the Boreal (a slightly cooler climate because of its plateau like elevation above the surrounding agricultural areas) Results indicated that the fire cycle in the DMPF has dramatically changed since the early 1700. In the pre-settlement period (1700-1880), which corresponded to the late portion of the Little Ice Age, the fire cycle may have been around 55-years with, on average, up to 1.8% of the area burning each year. Throughout that period, the authors speculated that large, infrequent fires have occurred in conjunction with prolonged droughts. Such an extreme drought was observed from 1885 to 1895 and coincided with about 83% of the DMPF burning, i.e., an area equal to 283,580 ha. During settlement, numerous small fires were observed at the periphery of the DMPF and were speculated to origin from land clearing. Despite these frequent fires, the length of the fire cycle has increased to about 200 years. On average, about 0.5% of the landscape was burning every year. more info: www.geostrategis.com/g_fires-duckmountain.htm  Forest Fire History Duck Mountain Provincia....kmz Forest Fire History Duck Mountain Provincia....kmz (217.55 KB) |
|
Full Member
Cartographer
May 2015 - Oct 21, 2024 18:35:52 GMT
“ Fellow Royal Canadian Geographical Society „
|
Post by jeanthie on Aug 5, 2015 2:12:19 GMT
In the Early days of the first Earth Resources Technology Satellite, I made some more contributions to the NASA 1967 Mission to Earth: Landsat views of the World publication. These were of course all related to my work in Canada's North. This 1973 July 30 image, plate 170, on page 205 of Mission to Earth, shows an active forest fire just south of Great Bear Lake in the North West Territories.  I have used that image in many of my presentations in those years discussing the major thrusts of the Canadian Remote Sensing Applications Program: 1. Resource surveys 2. Studies of natural change 3. Monitoring of man caused change I still have an overhead transparency which I have used for the selection below to give a better image of the actual burn area. The image above is an actual copy of the page in the book mentioned earlier  Monitoring of wild land fires became one of the most successful satellite application programs. A ‘quick win’ although it still took over a decade to become fully operational. Another quick win was almost the direct ‘opposite’: Ice surveillance. Why were we then so excited about these images? Of course, using spectral signatures we could experiment with automated satellite classification and analysis. But spectral analysis would give us ‘vegetation cover’ which was only meaningful if you understood fire history. But for us as ecologists, we could, for the first time see the ‘new’ dimension of landscapes and explore ecologically significant zones! The real significance of what was then recorded by Landsat, can now be further explored, interpreted and understood with Google Earth and Apple Maps. (Again, sadly as in many parts of Northern Canada Google image quality/ resolution is unfortunately much inferior to Apple maps) I will try to give some examples of interpretations of this 1973 Landsat image using the high resolution of today’s satellites in the following posts. Location overview of the area:  mission to earth-keller lake fires.kmz mission to earth-keller lake fires.kmz (536.2 KB) |
|
Master Guide
March 2015 - Jan 20, 2022 4:27:51 GMT
|
Post by Hill on Aug 5, 2015 23:30:56 GMT
Back quite a few years the GE default imagery was lower resolution. In Russia, Canada and Alaska as well as other remote areas, the spectrum was tuned to show burns as a bright red color . Using maps similar to yours I was often able to figure out the name of the fire as well as the date and area. When the newer default imagery was introduced that ability was lost. There were a lot of discussions about what those big red areas were. LINK
Here is one I was able to interpret. The imagery has changed now. |
|
Full Member
Cartographer
May 2015 - Oct 21, 2024 18:35:52 GMT
“ Fellow Royal Canadian Geographical Society „
|
Post by jeanthie on Aug 12, 2015 2:09:25 GMT
Hill, I remember the post and the discussion well. . Your link is still very useful. It is great to see the sophistication and effectiveness of the satellite enabled fire monitoring and mapping systems. At that time you said: The fire is still actually visible on the general, low resolution Apple maps imagery. Also the 1999 Kevenjik fire is visible on the 2000 Geocover Landsat Edition also included in WorldWind.  During that discussion in 2006 about the 'red areas' I started to work on a kind of 'red' fire legend for Eco-zones in Canada, but never did anything with it. It was still in one of my old PowerPoint files which I used for annotating images:  |
|


