Retrogressive Permafrost Thaw Slides
Mar 24, 2016 2:07:36 GMT
nostranger, diane9247, and 2 more like this
Post by jeanthie on Mar 24, 2016 2:07:36 GMT
RETROGRESSIVE PERMAFROST THAW IN THE TREVOR RANGE YUKON - EXPLORING PERMAFROST MELTING WITH GOOGLE EARTH
An excellent selection of sites in the Yukon showing significant slides and regression of permafrost in mineral soils was made available on Google Earth by "kingpointnorth" in the original Google Earth Community Forum. At that time I did a significant amount of work studying the melting and regression rates of landslides in Northern Canada.
To do this I used as base data Aerial photography taken in the North since the mid 1920's. From the 1950's on aerial photography becomes a more dependable source of information for comparison.
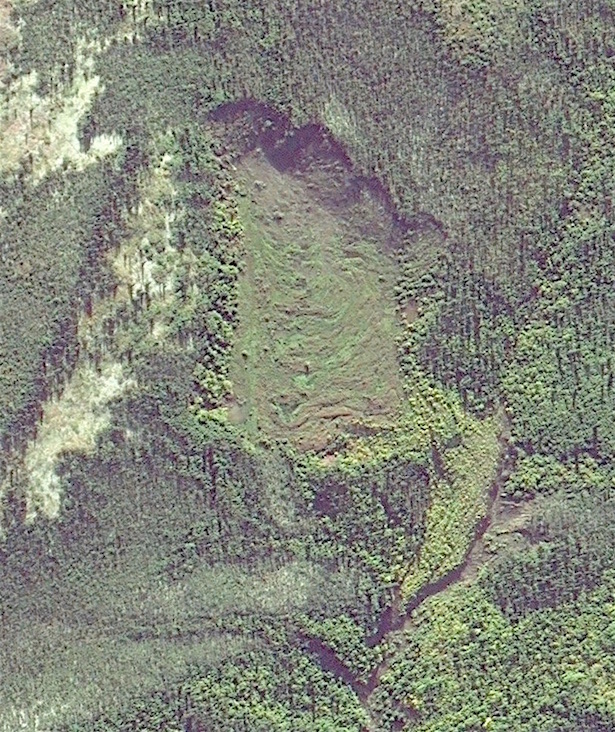
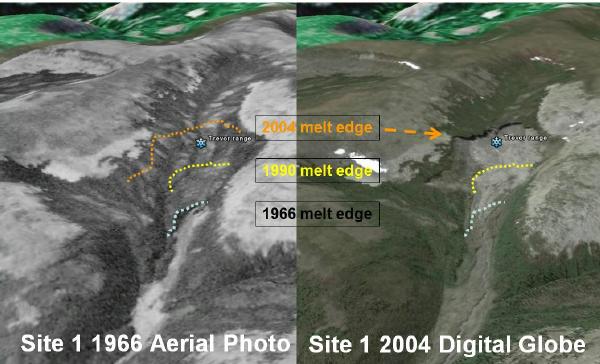
Figure 1 below shows a glacier like retreat of land based permafrost. It is based on a comparison and interpretation of a series of aerial and satellite images. The left is an 1966 July Aerial photo (A19650-67) draped over a Google Earth. To the right is the Google Earth high resolution Digital Globe July 2004 image. The grey dotted lines show the permafrost melting/ erosion edge in 1966. The Yellow dotted line is derived from a NASA Landsat 1990 low resolution image interpretation (WorldWind) and the orange dotted line is represents the GE 2004 digital Globe image.
The maximum regression distance over the 38 year period is about 850 meters, while the active edge is close to 890 meters in length. Average regression rate would be in the order of 20 meters per year . Most of it, certainly volume wise, in the last 14 years. There are no indications that this slide has been triggered by wildland fires as there is no evidence of fire history on the aerial and satellite images.
This melting and regression rate is comparable to other rates documented in the Yukon. Form example Burn and Friele (1989 Arctic vol. 42 no.1, p31-40) measure regression rates of up to 16 meters per year in retrogressive thaw slumps near Mayo, Yukon Territory
more information at: www.geostrategis.com/p_permafrost-slides.htm
1107312-PermafrostThaw1966-2005TrevorRangeS....kmz (177.52 KB)
An excellent selection of sites in the Yukon showing significant slides and regression of permafrost in mineral soils was made available on Google Earth by "kingpointnorth" in the original Google Earth Community Forum. At that time I did a significant amount of work studying the melting and regression rates of landslides in Northern Canada.
To do this I used as base data Aerial photography taken in the North since the mid 1920's. From the 1950's on aerial photography becomes a more dependable source of information for comparison.
Figure 1 below shows a glacier like retreat of land based permafrost. It is based on a comparison and interpretation of a series of aerial and satellite images. The left is an 1966 July Aerial photo (A19650-67) draped over a Google Earth. To the right is the Google Earth high resolution Digital Globe July 2004 image. The grey dotted lines show the permafrost melting/ erosion edge in 1966. The Yellow dotted line is derived from a NASA Landsat 1990 low resolution image interpretation (WorldWind) and the orange dotted line is represents the GE 2004 digital Globe image.
The maximum regression distance over the 38 year period is about 850 meters, while the active edge is close to 890 meters in length. Average regression rate would be in the order of 20 meters per year . Most of it, certainly volume wise, in the last 14 years. There are no indications that this slide has been triggered by wildland fires as there is no evidence of fire history on the aerial and satellite images.
This melting and regression rate is comparable to other rates documented in the Yukon. Form example Burn and Friele (1989 Arctic vol. 42 no.1, p31-40) measure regression rates of up to 16 meters per year in retrogressive thaw slumps near Mayo, Yukon Territory
more information at: www.geostrategis.com/p_permafrost-slides.htm
1107312-PermafrostThaw1966-2005TrevorRangeS....kmz (177.52 KB)